Your metrics, on dashboards you build
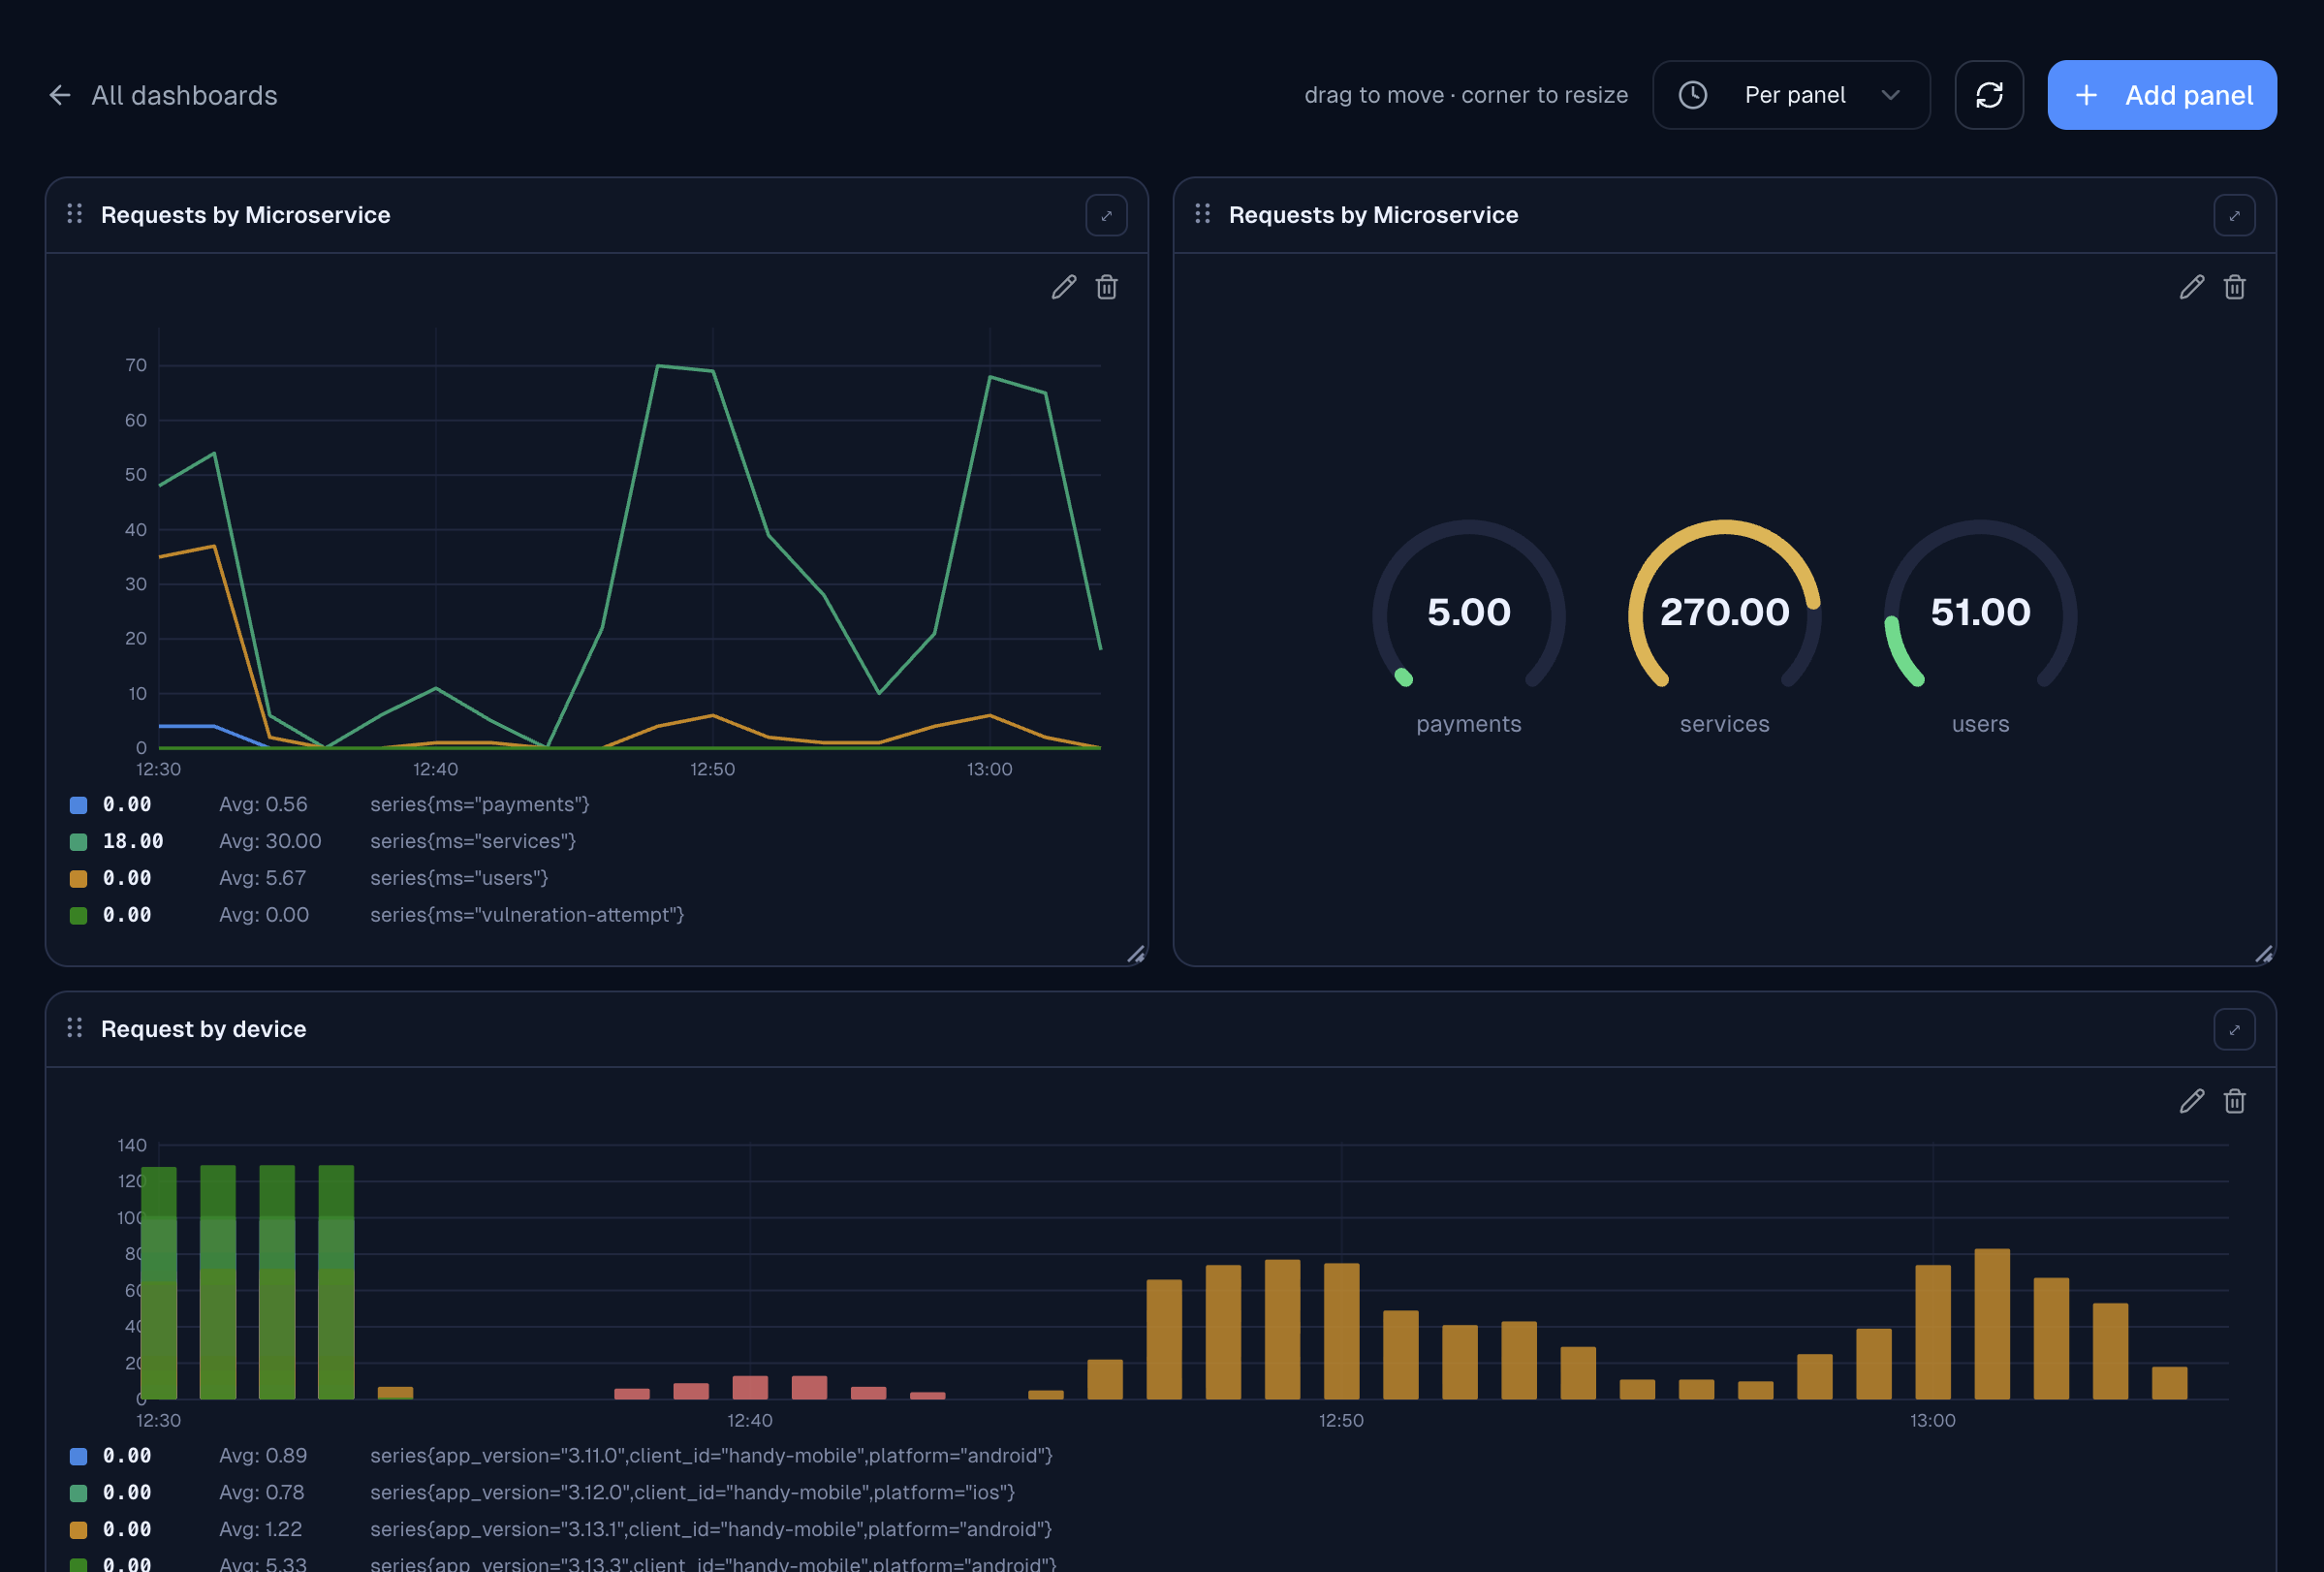
Archynt absorbs your custom Prometheus metrics and lets you build Grafana-style dashboards over them — free-form PromQL, multiple panels, fully org-scoped.
How metrics work
Custom metrics, absorbed
The agent ships the custom metrics you care about from your central Prometheus, keeping their labels intact — no per-service configuration on our side.
Faceted per host
Running the same service on multiple hosts or replicas? A shared metric is automatically split into one clearly labeled line per host on the same chart — never averaged into a meaningless blur.
Scalable storage
Metrics land in a time-series database built for the volume, so a busy system stays fast instead of bloating a relational table.
Free-form PromQL
Every panel is a PromQL query you write, with Grafana variables like $__rate_interval and $__range supported as-is.
Grafana-style panels
Time series, bars, points, stat, gauge and pie — with units, thresholds, graph styles and per-panel backgrounds.
Build your dashboards
Create dashboards for your organization, add panels, then drag and resize them into the layout you want.
Global time range
A dashboard-wide time picker re-scopes every panel at once; windowed queries using $__range follow it automatically.
See it live
Real dashboards from a live Archynt deployment