See the system
you actually shipped.
Archynt reads your code, watches it run, and fuses both into one living architecture graph — services, data, dependencies and the design risks that matter. No instrumentation.
- 4
- languages parsed
- <10s
- repo → graph
- 0
- app instrumentation
- 1
- graph · static + runtime
From repository to a living graph
Ingest
Clone or point at a local repo. Per-runtime workers parse Java, Node, Python and Go.
Graph
Facts normalize into one typed graph — services, data, topics, dependencies.
Project
Render C4 views (context → component) as live projections of the graph.
Reason
Deterministic detectors first, then AI explains the top design risks.
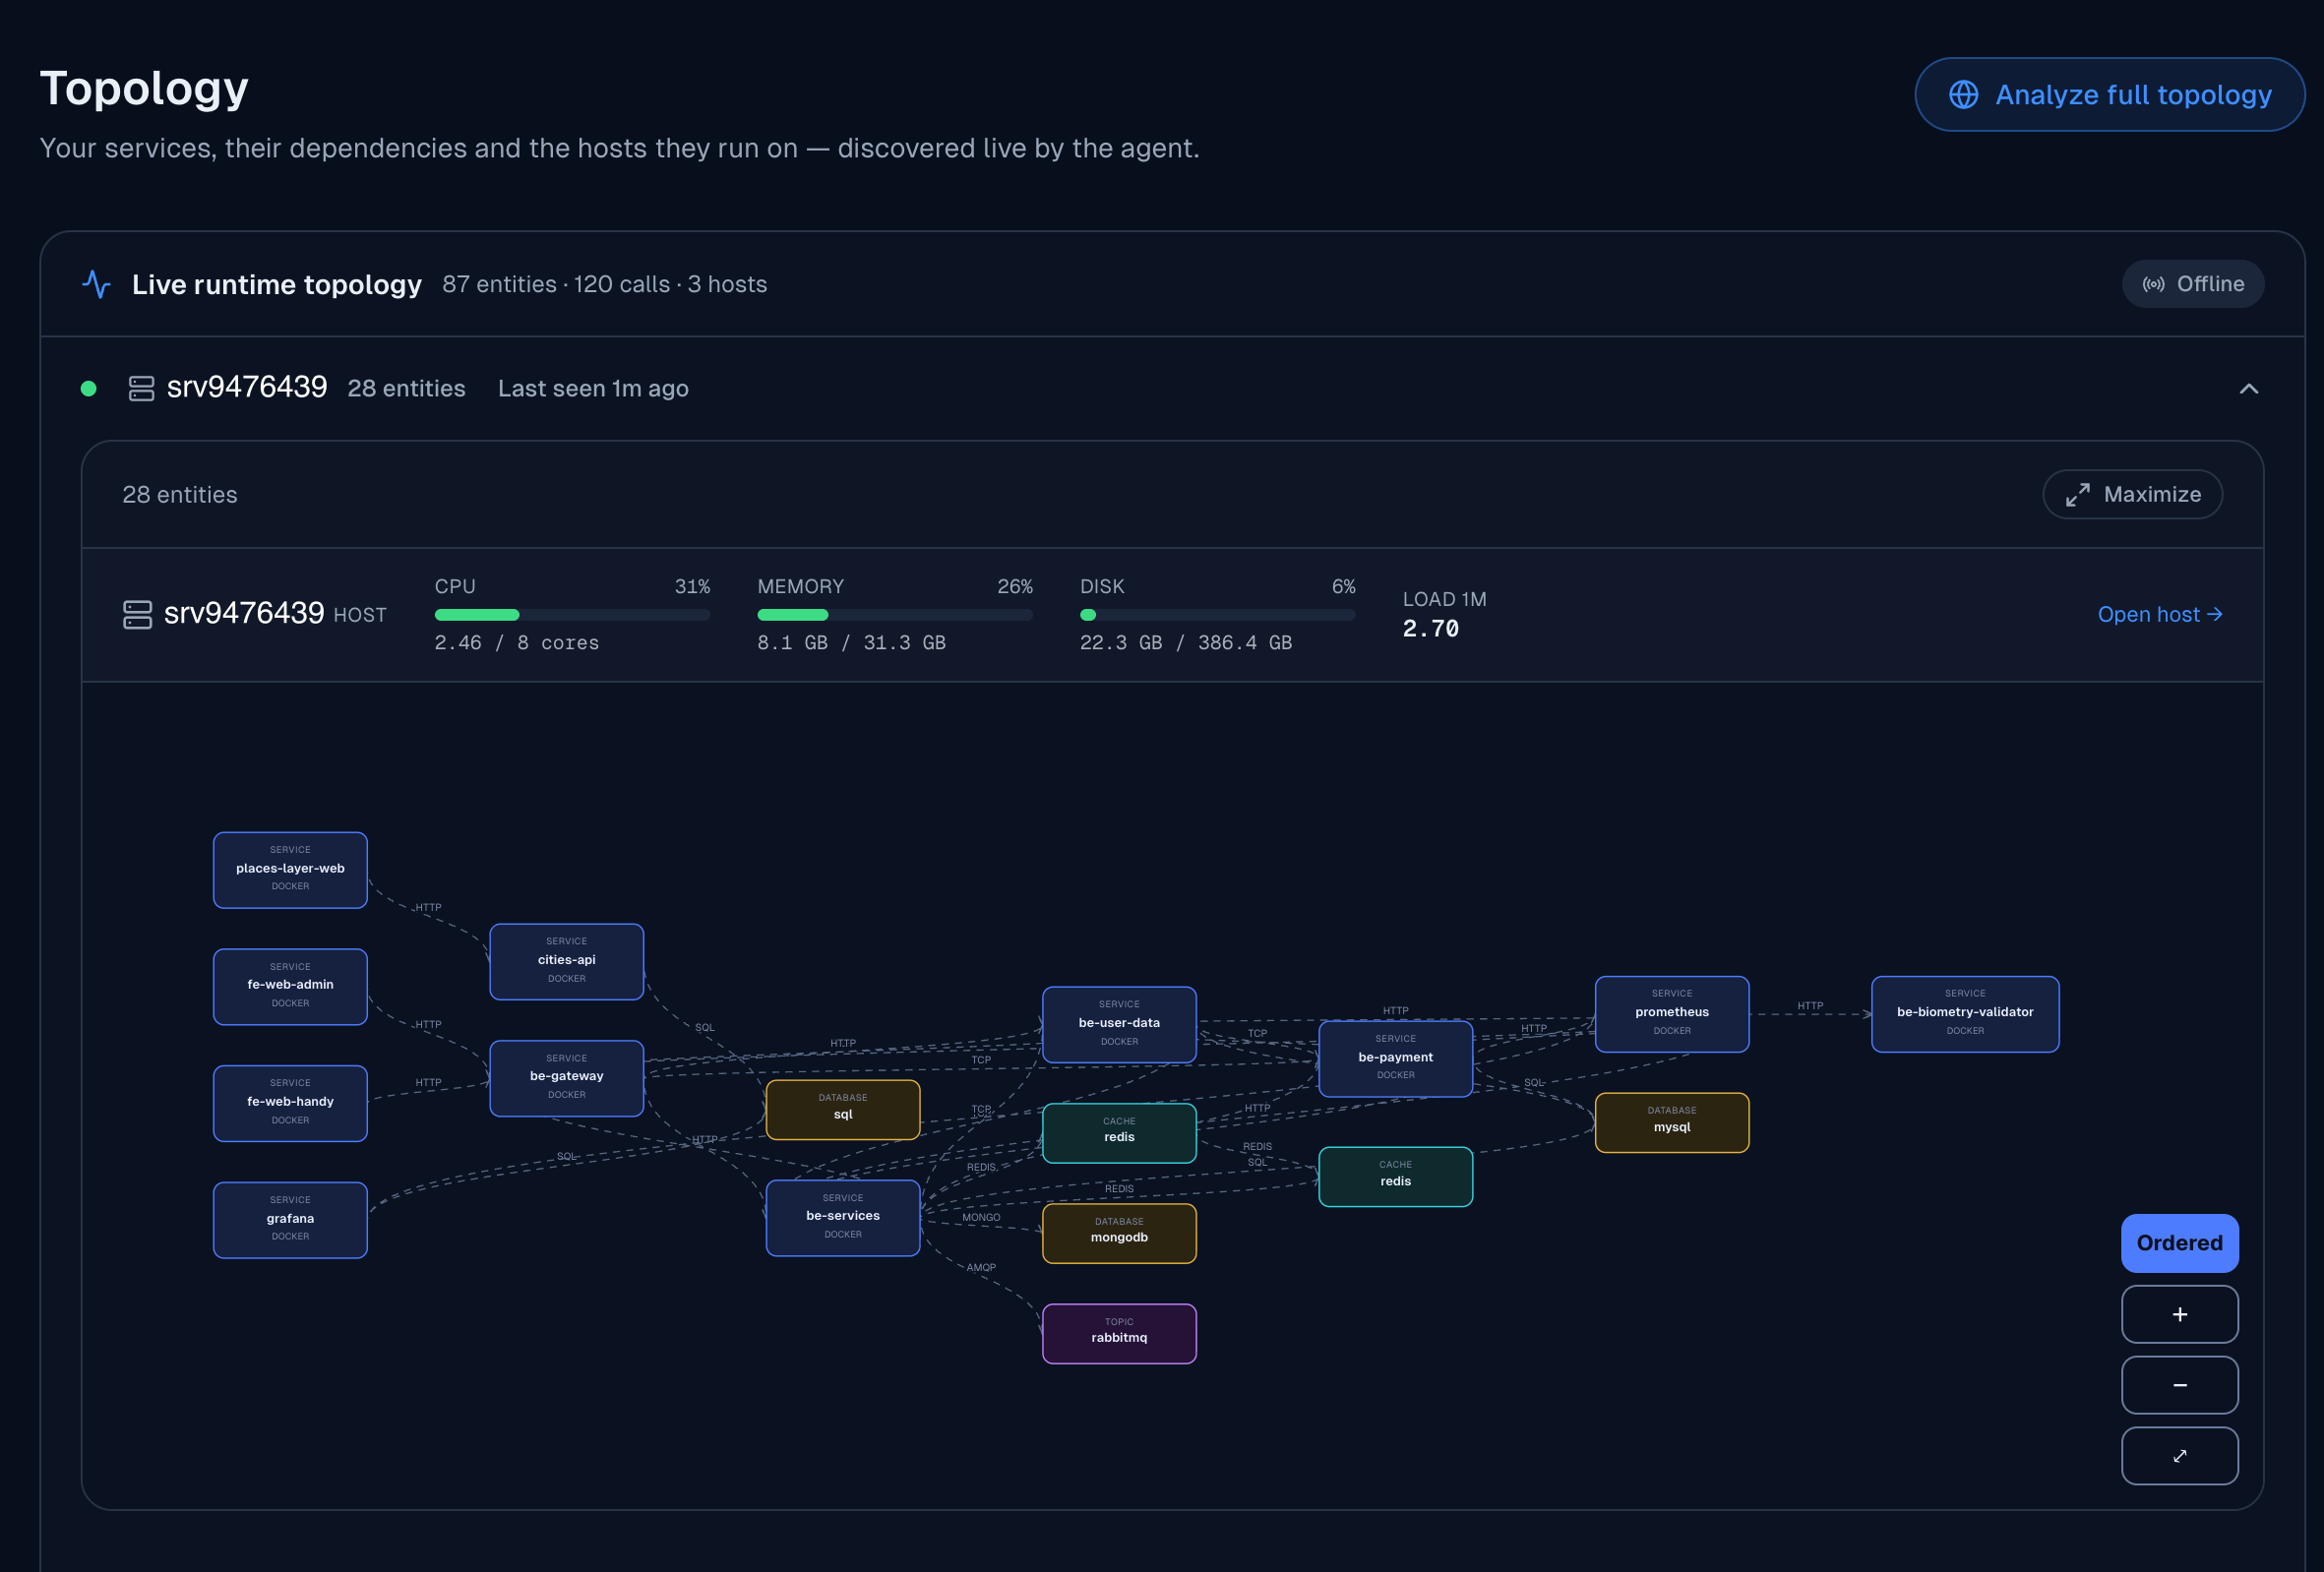
Topology discovery in real time
The agent discovers every container on the host, their network calls, and host metrics — live and continuously updated. Service dependency edges emerge from /proc/net/tcp analysis; no sidecars, no app instrumentation. The topology graph updates as you make changes, so you always see the real state of your system.
- Services, containers and dependencies discovered live
- Per-host topology view, never merged with other hosts
- RED metrics from Beyla eBPF sensor
- Host CPU, memory, network and disk stats
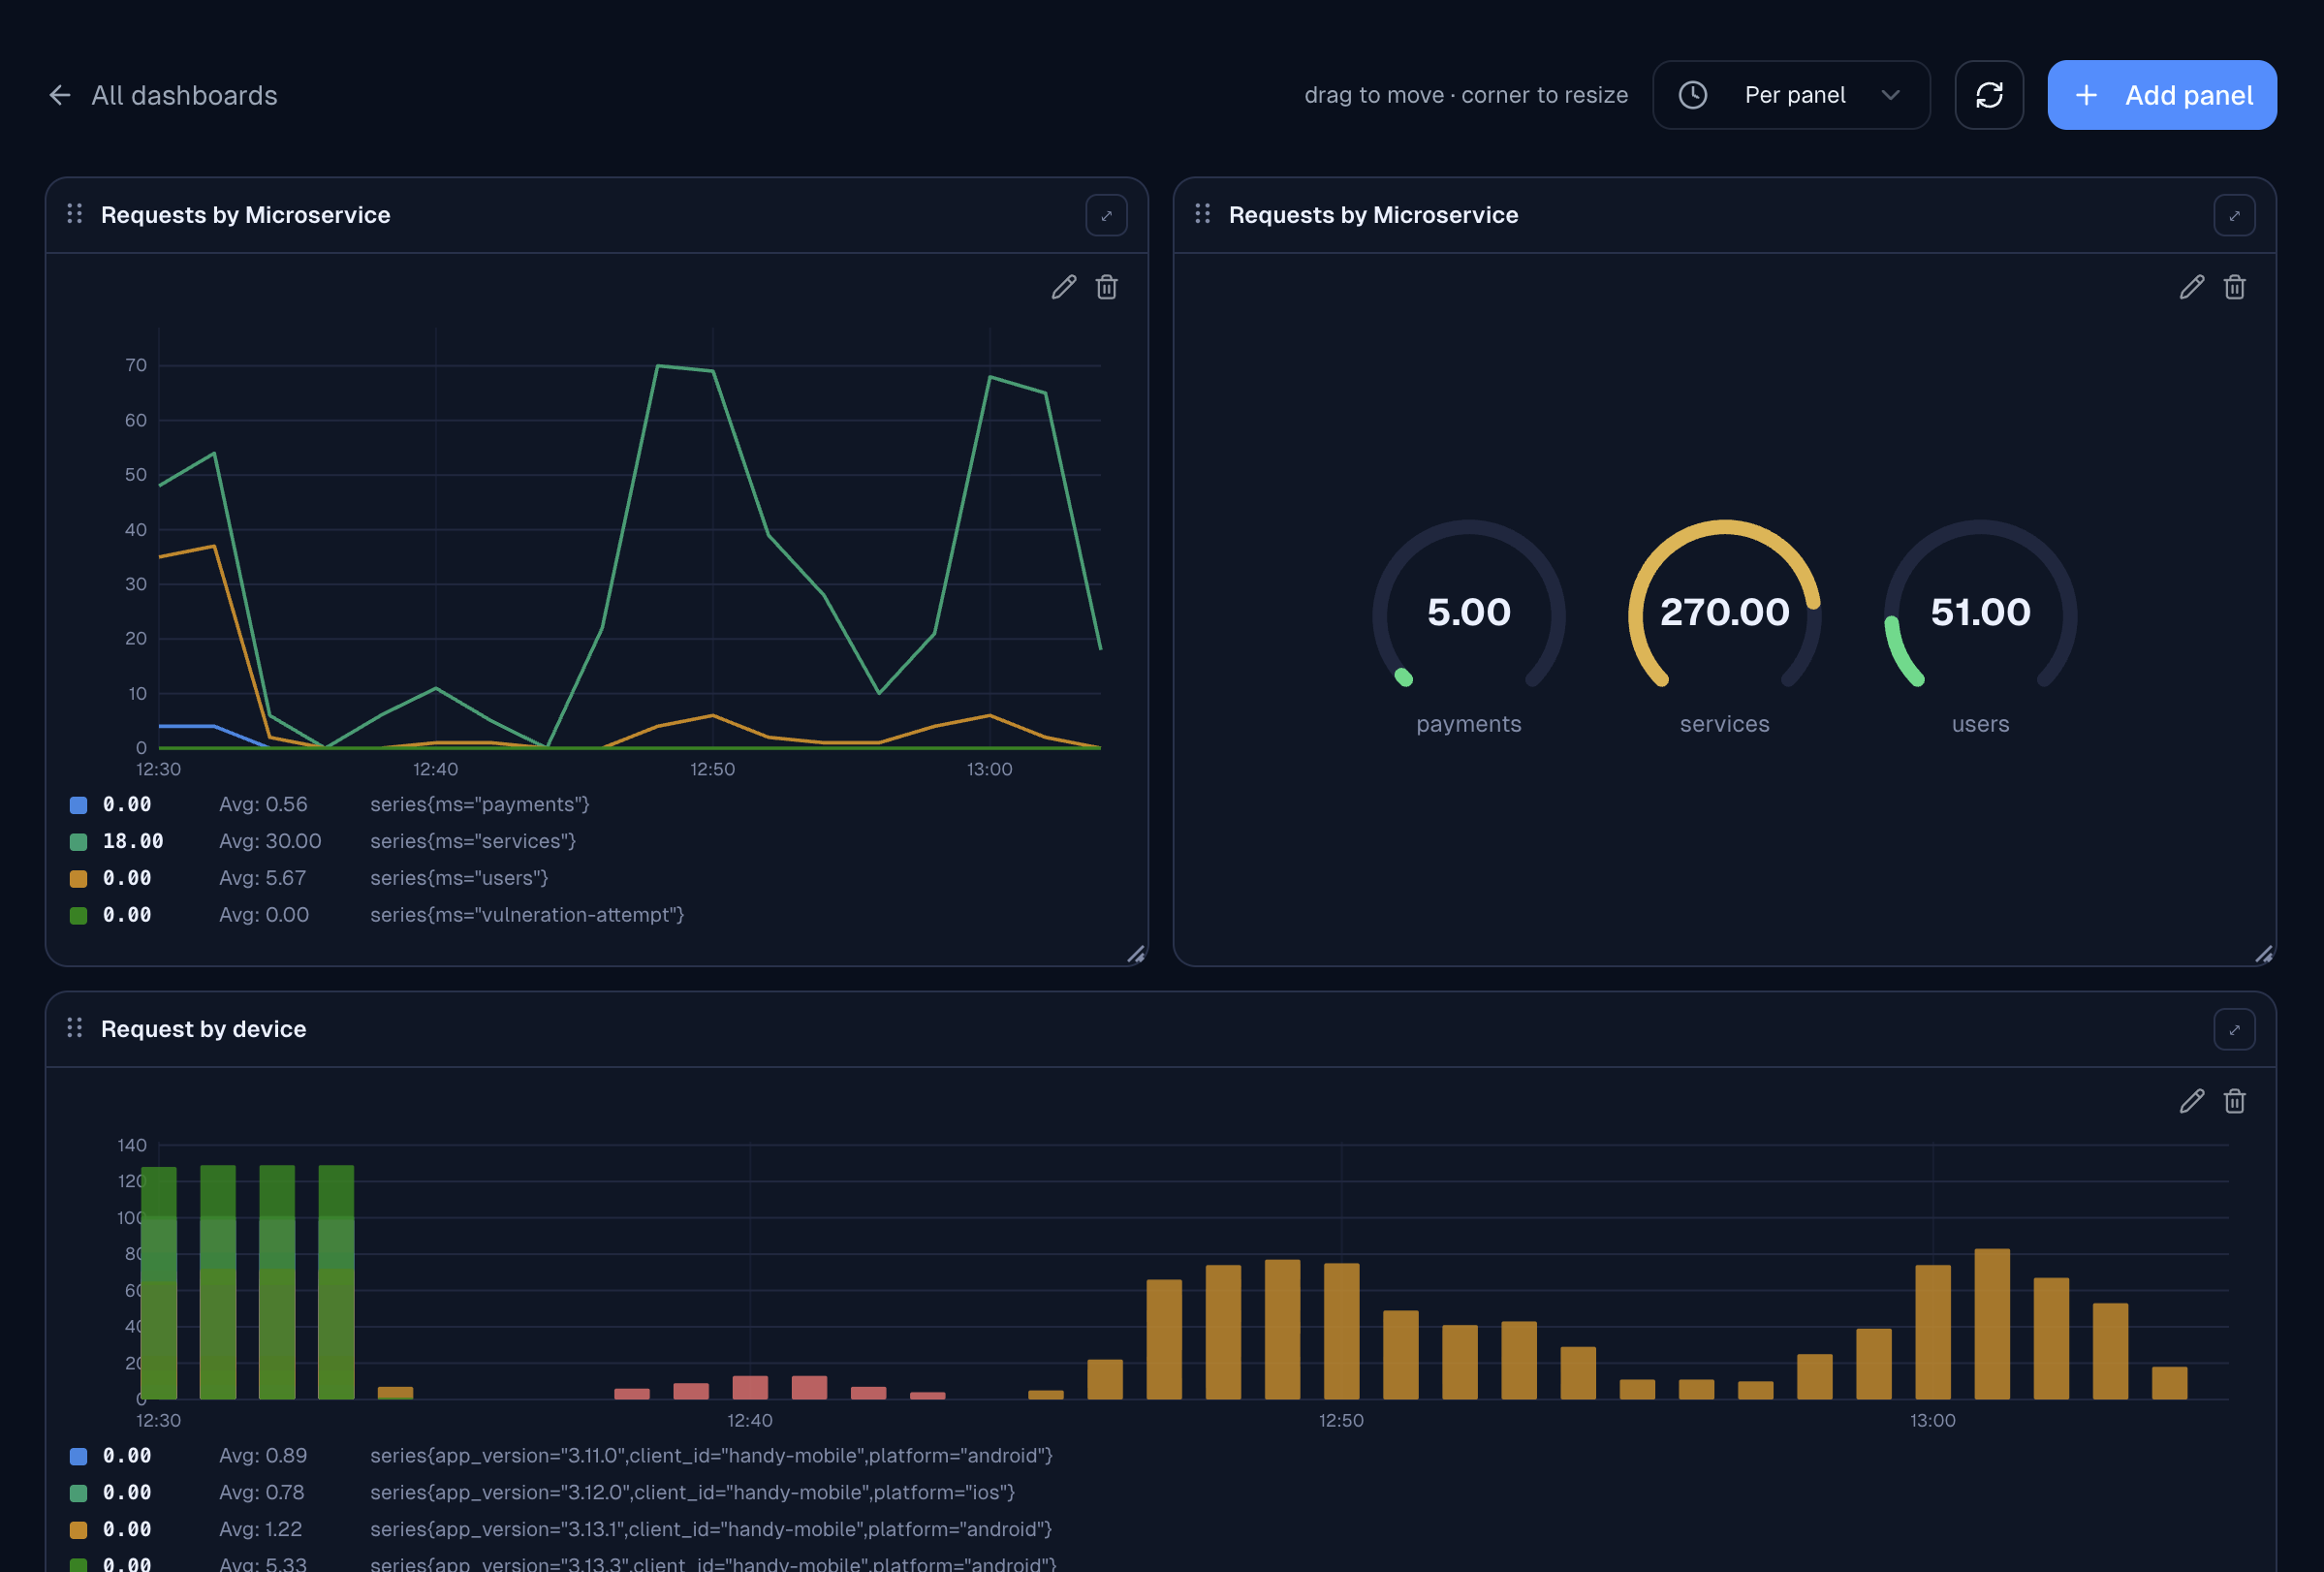
Metrics across every host, one chart
Archynt absorbs your Prometheus metrics and lets you build Grafana-style dashboards over them. When the same metric exists on more than one host or replica, it's automatically faceted — one clearly labeled line per host on the same chart, never averaged into a meaningless blur.
- Free-form PromQL, Grafana-style panels
- Automatic per-host faceting on shared metrics
- Global time range across every panel
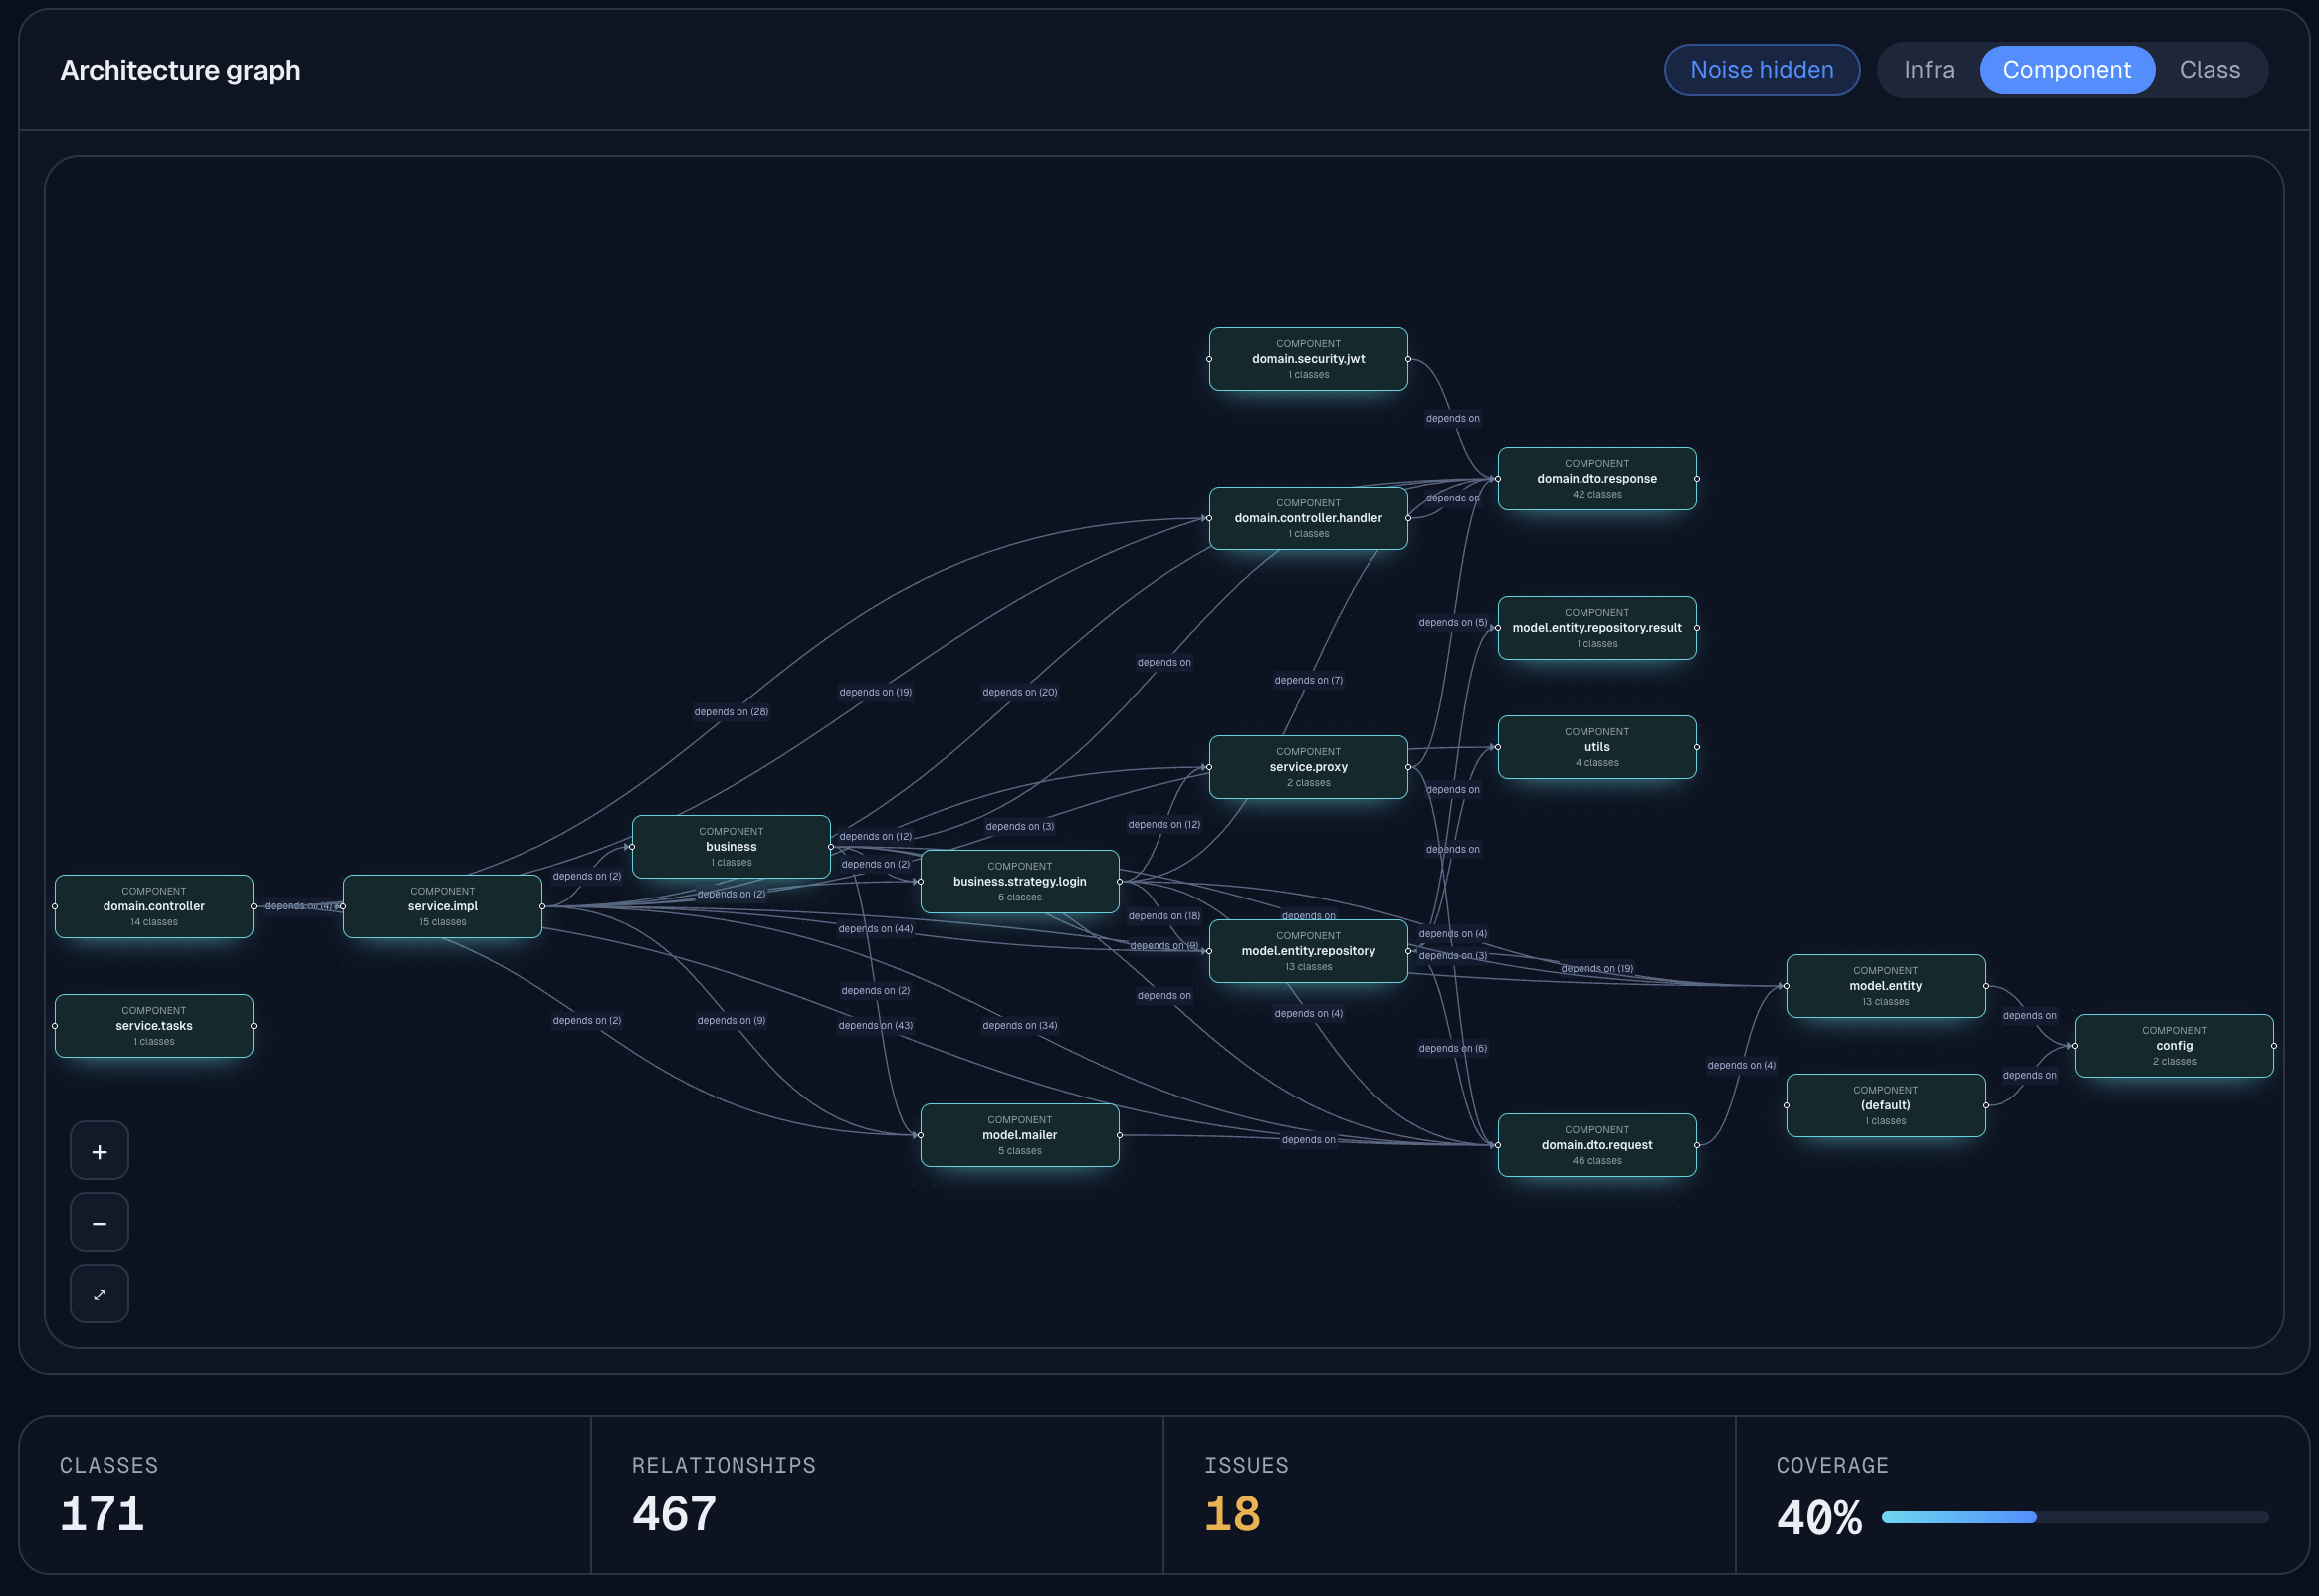
Diagrams that can’t go stale
C4 views are projections of the graph, not hand-drawn docs. Re-analyze and the picture updates itself — with a noise filter that collapses boilerplate so you see the real shape of the system.
- Context → container → component
- Deterministic relationship extraction
- Noise filter for DTOs & boilerplate
What it really does, per host
A read-only agent discovers live services, their real dependencies and host pressure — zero app instrumentation. Multiple hosts stay cleanly separated: each host gets its own topology view, so two servers running the same service never get merged into one confusing graph. The runtime graph fuses with the static one: confirmed_by static · runtime · both.
- One topology view per host — never mixed
- Live topology, RED & host metrics
- Static ↔ runtime correlation
- Docker today — Kubernetes & systemd on the roadmap
 Docker
 KubernetesSoon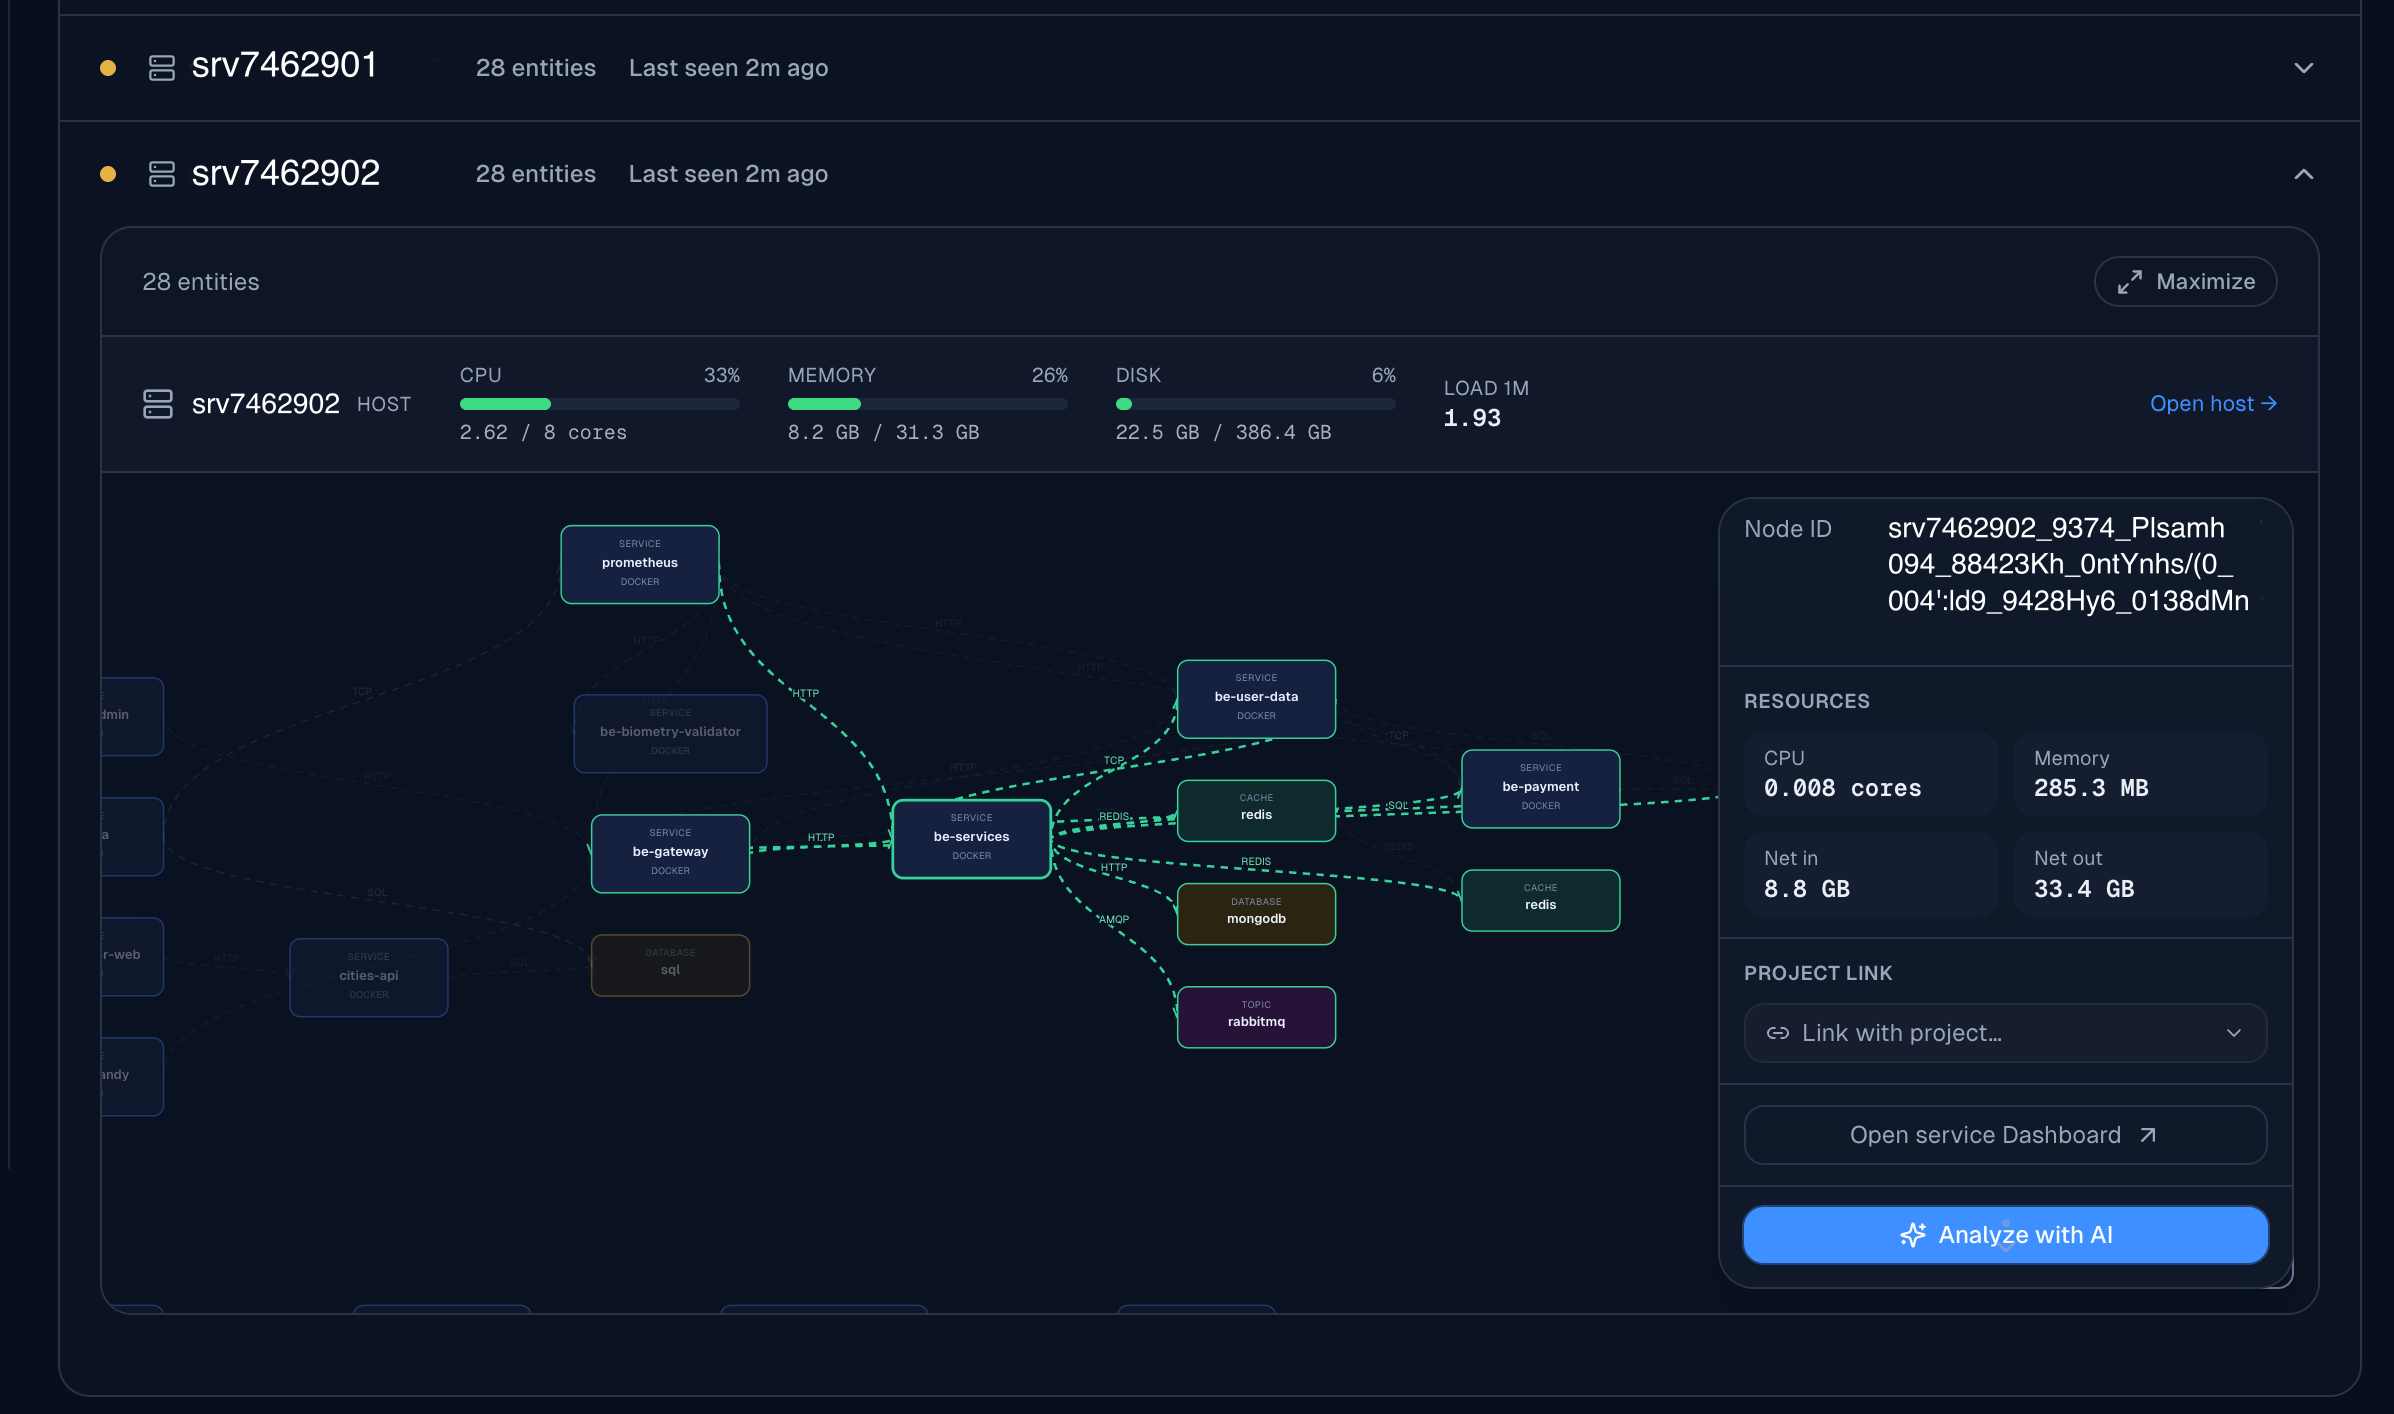
Everything in one graph
Design issue detection
Cycles, coupling/instability, single points of failure and dead code — explained, not just flagged.
Polyglot, one contract
Every analyzer emits the same AnalysisFacts, so all four languages feed the same graph.
Test coverage signal
Which production types your tests actually exercise, mapped onto the graph.
Live, editable dashboards
Per-service metric panels you can drag, resize and configure — like Datadog, faceted per host, from the same graph.
Free PR checks for public repos
Add one GitHub Action workflow and get architecture checks on every PR — no signup, no token shared with Archynt.
Point Archynt at a repo.
See the architecture you actually shipped.
No instrumentation, no setup. A Git repository URL is enough to get a graph, C4 diagrams and a ranked list of design issues.